Nowadays, we are able to utilize massive amounts of data related to organisms, human society, and the universe. However, as the volume of data grows, or as the data change temporally and spatially to adapt to new information, the difficulty and effort of extracting important information will continue to increase. The aim of the “Image Data Analysis” project is to convert a variety of data into a form that people can visualize, and from which they can intuitively extract important information. We talked to project leader Professor Tomoko Matsui and assistant leader Associate Professor Yoshida, who have conducted significant research in this globally active field.
Accumulation of knowledge on visualization technology
The objective of our project is to visually express complex phenomena using a variety of data. Researchers from fields such as biology, neurology, medicine, and human society have come together to participate in this project. The idea is that, as these researchers develop visualization technologies on their own, the accumulated knowledge will be accessible to a wider range of people. One of the important roles of “image data analysis” is to convert massive amounts of data into a form that people can understand and use to predict new, original facts and mechanisms. It is my opinion that people find it difficult to develop new ideas from something they do not understand. Let me introduce you to the research that Professor Yoshida is doing as a concrete example of this “Image Data Analysis” project. (Matsui)
Visualization of neural activity in the entire central nervous system of C. elegans
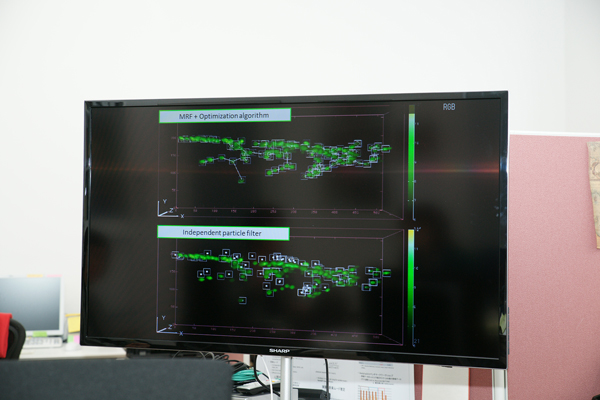
I work with life science data in the field of neuroscience. The nematode Caenorhabditis elegans (C. elegans) is an extremely important model organism in developmental biology and neurology. The synaptic connectivity of all 302 neurons in C. elegans has been completely described. Despite its simplicity, the central nervous system (CNS) of C. elegans can integrate many functions, such as memory, associative learning, and decision-making, raising the prospect of the comprehensive understanding of the neuronal basis of an animal’s entire behavioral repertoire. We are now developing a live-cell imaging technique to measure the multi-neuronal activities of the entire CNS. A confocal microscopy is used to track the spatiotemporal dynamics of the calcium ion concentrations in the neuronal nuclei. Recently, we succeeded in measuring the activity states of most neurons in the CNS. During the measurement, in which a worm is stimulated by an odor or a repulsive metal ion, the worm’s body posture can change irregularly in the field of view. To quantify the neural activity with such time-lapse 3D images, it is necessary to track the movement of each of the imaged neurons. However, the accurate tracking of this many objects is a difficult task. Based on the idea of Bayesian statistics and machine learning, we have developed a novel cell tracking method with excellent accuracy (a result is shown in the upper part of the following photo). With this technology, we can directly observe the responses of the nervous system to stimuli, and have discovered new facts on the operating principle of the neural circuits. (Yoshida)
Innovation in bioimage informatics
During the past decade, we have seen dramatic advancements in bio-imaging technologies. The deluge of complicated cellular and molecular microscopic images gives rise to a compelling challenge, and advanced technologies in machine learning, computer vision, and statistical science are now being introduced very rapidly into the fields of biology and medicine. This emerging new area is called “bioimage informatics.” In such data-intensive life sciences, statistical science plays an extremely important role in exploring what can be acquired from the data. It is our challenge to identify unique approaches to scientific problems from an original perspective of statistical science. We would like to pioneer new methodologies in the life sciences. (Yoshida)
Software to explore feelings as hidden information
In addition to converting massive amounts of invisible data into a form that people can see and understand, we are extending our research and focusing on technologies that probe into emotions, which are the source of the data that we can now see. For example, consider human movements. When we are feeling good, we skip around; when we are feeling down, we move more sedately. Frequently, we are moving in this fashion because we are experiencing certain feelings. I have developed software that can statistically predict feelings as “hidden information” based on certain walking characteristics, and can identify movements more reliably. In the future, I would like to apply this to various identification problems, and examine the information hidden behind the data. (Matsui)
(Text in Japanese: Tomoko Matsui, Ryo Yoshida, Rue Ikeya. Photographs: Mitsuru Mizutani. Published: April 10, 2015)