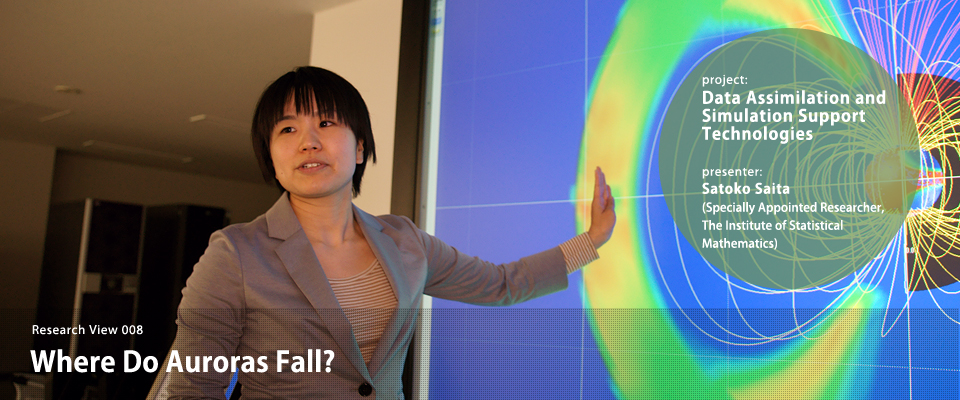
In the current era, the movement of astronomical objects can be predicted with high accuracy. Similarly, can we predict aurora much like weather forecasting? Found only at night in high-latitude regions such as Antarctica and the Arctic, how are auroras related to our lives? ──This time, the topic is a study using a method of "data assimilation" to understand the phenomenon of aurora and obtain knowledge useful to our lives. For the third round of the "Data Assimilation and Simulation Support Technology" project, we introduce the research conducted by Satoko Saita, a specially appointed researcher (the Institute of Statistical Mathematics). This stage of the project originated from her interactions with the National Institute of Polar Research.
Reproducing the phenomenon called “aurora” with calculations
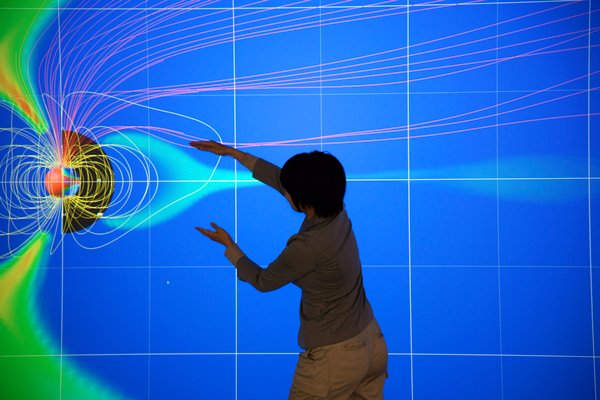
The picture above shows a simulation of the Earth’s magnetosphere modeled by magnetohydrodynamic equations. The satellite orbits the "Lagrange points" of gravitational equilibrium between the earth and the sun, and observes the properties such as the plasma density of solar winds. By processing the acquired data and performing calculations using computers, it is possible to draw such a map. Flowing from the sun to the earth, there are high-speed and high-energy plasmas called "solar winds". The green to red bands show the plasma pressure, indicating the strength of the plasmas hitting the earth’s magnetosphere. The lines indicate the magnetic field created by the earth. This magnetic field is created because the earth's core undergoes heat convection under the influence of the earth's rotation, similar to the situation of a current flowing through a coil. Plasmas have properties that do not allow them to cross the magnetic field lines, which is why they are turned back without hitting the earth directly.

Night with plasmas from the sun
The earth's magnetic field flows from south to north. Not much happens when the magnetic field of the solar wind is directed parallel to that of the earth. When they become opposite, however, and the magnetic field lines of the solar wind and the earth approach one another, magnetic field diffusion appears. Then, a phenomenon called "magnetic reconnection" occurs in which two magnetic field lines become connected. When this happens, the earth's magnetic field lines are diverted along with the solar wind and pulled towards the night side of the planet. The magnetic field lines pulled towards the night side in the Southern Hemisphere point in the opposite direction to those entering the Northern Hemisphere, causing another "magnetic reconnection". When this occurs, the plasma contained in the solar wind rides the earth's magnetic fields and falls onto the South and North Poles. The atoms and molecules in the atmosphere become "excited" by collisions with the plasma and emit light of specific colors, green and red for oxygen, and pink for nitrogen. These light bands in the ionosphere, approximately 100 kilometers above the surface, are aurora. The regions with frequent occurrences of aurora form an elliptical shape surrounding the earth's magnetic poles, and thus, are called auroral ovals.
Earth's data are pinpoint data
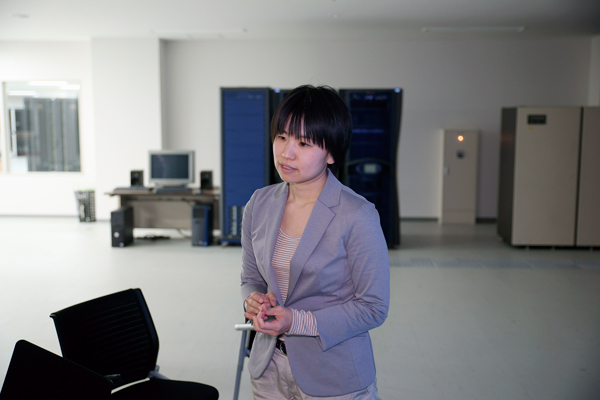
Before joining the Institute of Statistical Mathematics, I was affiliated with the National Institute of Polar Research and have experience in setting up observation devices in Antarctica for magnetic measurements. I started to study auroras in 2007. It is noteworthy that this phenomenon contains all of the relationships between the earth and the sun, and watching auroras is the same as watching the changes in space. The field that focuses on the upper atmosphere is called "aeronomy". While this field involves building physical models, they do not always reflect the reality completely. This is because geophysical data are extremely limited both in location and time. What a satellite can observe is merely a single point in space and time in this wide universe. However, using statistical methods greatly helps us to extrapolate the entire picture from limited data. My previous studies, which could only explain a phenomenon at a certain time and location, can now explain the phenomena occurring at other locations without data.

Simulations useful for daily life
Because the locations of aurora can be observed from the earth, it is possible to make the simulation values close to the real values. In 2011, for example, we reproduced the large movement of aurora in longitudinal directions using simulations and explained the difference between the shapes of auroras observed at the Showa Station in Antarctica and in Iceland (the paper can found here). Today, we are focused on data assimilation, which aims to match observation data from the ionosphere to simulations to calculate the boundaries of the magnetosphere and the ionosphere more accurately. However, the results are not sufficient at this point because we can only predict where auroras will appear. Using data assimilation, we aim to depict aurora as close to the reality as possible by understanding how physical quantities are exchanged between the magnetosphere and the ionosphere, though what processes and with what relational expressions. This modeling is important not only because solar winds are harmful to life on earth but also because they can damage satellites, which could in turn cause problems in the telecommunication systems we use daily or damage the transformers of some large electric companies. We would like to reach a point where we can discuss the problems with more quantitative estimates of the level of strength of the electric currents and the way that they flow to the ionosphere.

(Text in Japanese: Satoko Saita, Rue Ikeya. Photographs: Mitsuru Mizutani. Published: June 10, 2014)