Special Assistant Professor Masaya Saito (Institute of Statistical Mathematics) is involved in the Data Assimilation and Simulation Support Technologies project. Using data assimilation, he is working to predict how infectious diseases such as influenza will spread through cities. Data assimilation is one of the latest statistical methods. How can its application to specific themes, such as the spread and control of infectious diseases, help us in living better lives? What kind of difficulties can it present? We introduce the current status of this research and development, which is evolving each day.

Preparing for a Pandemic with Data Assimilation
Many people will remember the spread of a new strain of influenza in 2009. In June of that year, the World Health Organization (WHO) declared a “Global Pandemic” and the word “pandemic” quickly spread throughout Japan. These events caused us to examine the possibility of taking countermeasures against such a problem. We began discussions with a group at the University of Tokyo’s Institute of Medical Science, with whom we had already established an exchange. In Japan, the new strain of influenza virus progressed by initially spreading throughout the Kansai region with infections eventually appearing in Tokyo. Some wondered whether it would be necessary to halt train services completely between Osaka and Tokyo to intervene in the spread of such a virus. We decided to investigate the possibility of reducing the spread through skillful use of vaccination, without resorting to stopping the trains. If we were able to predict the spread from one city to another, we could demonstrate the need for joint initiatives by local governments, rather than individual measures. The creation of an infection prediction simulation for this purpose gave rise to the current research.

Making Estimates from Two Uncertainties
There are difficult aspects of infectious disease data. First, there is no way to recreate phenomena experimentally, so data is extremely limited. Second, there is a level of uncertainty from the fact that coming in contact with someone does not necessarily mean that the person(s) will be infected or become ill. These two kinds of uncertainties mean that we need to add multiple envisaged scenarios to the simulation computation, creating a volume of computation that can produce a prediction only after more than a day of work by a super computer. Data assimilation shows its incredible power in cases such as this, where the amount of obtainable information is limited, and multiple possibilities need to be followed through, simultaneously.

The Effectiveness of Random Numbers in Recreating Phenomena Appropriately
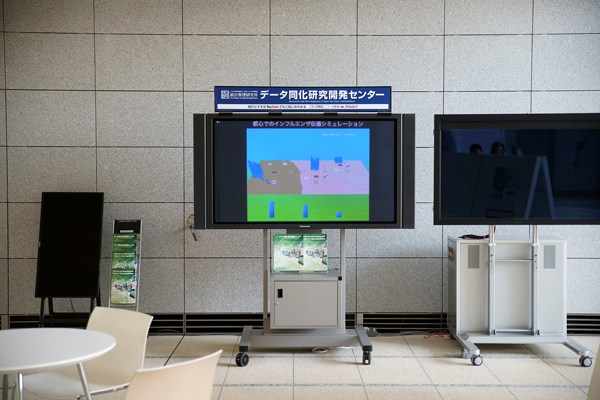
Meanwhile, we also created a video visualizing the spread of the infection while people commuted to work and to school in an extremely simple case of three towns connected by railway, each with its own companies, schools, households, and parks. This sort of simulation does not describe the movements of each person individually, and aspects such as crowded trains, or irregular movements, such as visiting the park around twice each week are recreated using random numbers. With respect to infection, even if infected people come in contact with healthy people, they may not pass on the infection, but, overall, we can assume a certain probability of them infecting others, and random numbers can be used in a similar manner to obtain the trend of the infection spread. Using this simulation, we were able to make predictions about slowing the infection by vaccinating all of a company’s employees at a certain point.

Using Actual Data to Make More Specific Predictions
Although we are now able to make these kinds of predictions, the actual survey results for infected people are yet to be reflected in the simulation. We are currently searching for a method of data assimilation that will match the simulation to the actual data perfectly. In doing so, we believe that using a model that is slightly more abstract than one that uses items such as companies and houses, may enable the incorporation of the kind of system that could be used for giving forecasts. Our ultimate goal, then, would be to anticipate, for example, how the number of infected people would increase in the following week on the basis of data such as the number of infected people traveling between Tokyo and Osaka. In 2009, the “defend at the border” strategy was adopted, but there was the problem of the incubation period and an expert in infectious diseases later produced research results showing that in the worst case, 90% of infected people would pass through the defense. In this case, statistics should provide useful insights, and we aim to continue working to create useful tools for government decision makers and people in their everyday lives.
(Text in Japanese: Masaya Saito, Rue Ikeya. Photographs: Mitsuru Mizutani. Published: May 20, 2014)