
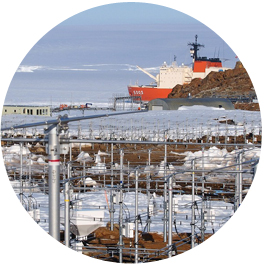
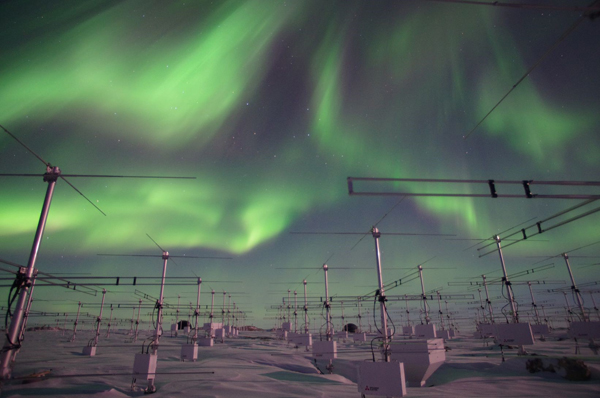
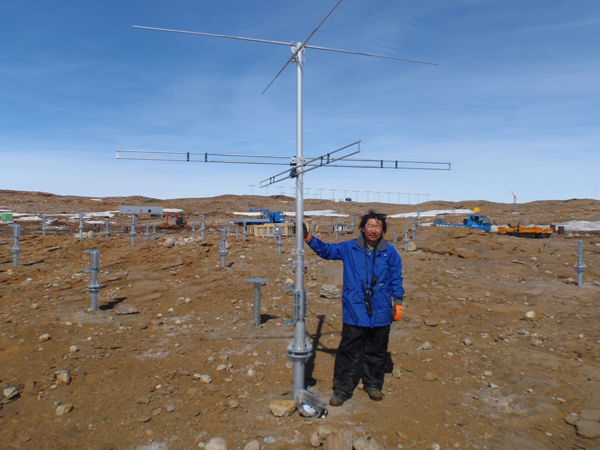
We have been conducting research observations with the "Program of the Antarctic Showa MST/IS radar" (PANSY radar) since 2012. The radar utilizes a technology called the "active phased array antenna", in which each antenna in the numerours array is carefully controlled. PANSY has a very unique characteristic: it accurately measures vertical winds over Antarctic using 1045 antennas when in full operation. However, because radars only records received electromagnetic waves, meaningful physical quantities such as temperature or velocity cannot be directly derived from the raw data. Currently, the Earth Environment Data Department at Research Commons is analyzing and processing the PANSY observation data appropriately and taking part in the development of an archive for the next 5 years or 10 years. This database will be expected to further facilitate shared use of indispensable, valuable data for research for the prediction of climate change on earth.

Capturing the 3D structure of the atmosphere with radar
Radar sensors familiar to us may include the speed guns used to confirm speeding violations on the road. If the radar gun releases an electromagnetic wave, it hits the car and is reflected back towards the sensor. Because the wave reflected from a moving object has a slightly different frequency due to a phenomenon called the Doppler effect, it is possible to measure the car's speed. PANSY uses the same principle, sending electromagnetic waves and receiving reflected waves. Because the waves are created by PANSY itself, the closer the point of reflection is, the sooner the wave comes back and vice versa. By slightly tilting the direction of wave release, it is also possible to measure from different angles and capture the 3D structure of the atmosphere. Unlike radio telescopes and optical telescopes, a major characteristic of radar measurements is that it is possible to observe at a high resolution in the depth direction. PANSY uses radio waves with a VHF of 47 MHz to view the Antarctic atmosphere with a maximum resolution of every 75 to 150 meters. It reaches up to the upper atmosphere at an altitude of 500 km, but it is most suited to observing the dynamics of the atmosphere within 100 km of the earth's surface, the region directly linked to climate change.

The earth's atmosphere consists of thin layers
The earth's diameter is approximately 12,700 km, and the majority of the atmosphere is composed of thin layers a few hundred kilometers in thickness. Temperature significantly changes if the altitude is different only by 1 or 2 km. In other words, the atmosphere above the Earth consists of very thin layers. PANSY conducts observations of the atmosphere between the ground and the upper atmosphere, continuously, as if launching hundreds of sounding rockets into the air each day. As the energy from the sun reaches the earth, a part of the atmosphere heats up and starts to move. ──This becomes the wind. Because the lower atmosphere is denser than the upper atmosphere, winds generally do not go against the gravity but mostly move parallel to the surface. However, cumulonimbus clouds, thunderclouds, and fronts can cause an updraft, or air can ascend along high mountains such as the Himalayas. In fact, these phenomena are keys to revealing the details of climate change and the atmospheric cycles. There are no instruments other than radars that are able to observe such vertical movements.
Capturing the small "atmospheric waves" in the atmosphere
It was discovered 30 years ago that very small “atmospheric waves” generated from disturbances such as updrafts can be a driving force for the atmospheric flows of the entire earth, which attracted much attention. For example, updrafts associated with cumulonimbus clouds generate atmospheric waves around the equator, which are transmitted upward and then dissipated, creating an atmospheric flow. It has been discovered that these waves are very strong near Antarctica. The atmospheric flow of the entire earth has a scale length of approximately a thousand to tens of thousands of kilometers. However, these atmospheric waves are a smaller phenomenon compared to the scale length used for a weather map and could be as small as 10 kilometers in horizontal size and 3 kilometers in the vertical wavelengths. These waves cannot be observed by satellites, and the degree of resolution is not sufficient because they are smaller than the masses of air handled by weather forecast models. PANSY also plays a role in capturing such fine structures of the atmosphere above Antarctica.

Catching shooting stars and cosmic rays from the ground
In principle, it is possible to zoom in and collect very detailed depth measurements in radar observations, but the data volume would be enormous. In other words, radar observations constantly face the challenge of memory or storage capacity. For example, if PANSY sampled and stored data every microsecond for each atmospheric layer, the data for one day would total 80 giga samples, as one day is approx. 80,000 seconds. In response to the rise of data-centric science, we are working on data mining, in which we try to extract valuable information from such big data. New ways of using data, such as tracking satellites and observing cosmic rays falling on earth, have been identified, although we did not anticipate these outcomes upon building the atmospheric radar. In addition to developing these data processing and analysis methods, we are constantly improving the system that distributes the observation data without delay from Antarctica by using the limited capacity of satellite channels. In addition to the current public data, we are steadily preparing for the expansion of target data and for quicker releases of detailed data.

(Text in Japanese: Takuji Nakamura, Rue Ikeya. Photographs: Mitsuru Mizutani. Published: January 13, 2015)