


Understanding the ‘alley logic’ through data
“Does this have something to do with rojis?”
The question came to Prof. Mayumi Oka’s mind while conducting research on how to prevent suicide years ago. Risk factors for suicide can range widely, including one’s economic and social backgrounds, but Oka, the specially appointed associate professor at the Institute of Statistical Mathematics, was particularly focused on the physical environments surrounding victims in her study. The data showed, she said, almost all communities with lower suicide rates had something in common: a large number of ‘rojis,’ or alleys. Since long before the advent of the Big Data Era, Prof. Oka has been known for her data modeling work, which she does manually by combining results of field research, or “qualitative research,” with computer data analysis, or “quantitative research.” We recently sat down with Prof. Oka and her research collaborator, Associate Prof. Takafumi Kubo at Tama University, to hear what their data-driven research reveals about the relationship between alleys and suicide.


Ask the Expert: Dr. Mayumi Oka (Specially Appointed Associate Professor both at the Institute of Statistical Mathematics and Keio University)
A health sociology and social epidemiology expert, Prof. Oka is known for her community-based research on such social issues as suicide and family care. Her social research combines qualitative and quantitative approaches to develop useful indexes through painstaking field observation as well as the quantification of social factors. She is the author of the book, “Ikigokochi-no yoi machi” (The Coziest Towns to Live) in which she discusses preventive factors for suicide. Prof. Oka received her PhD from Keio University. Since April 2021, she has served as a visiting professor at the Institute of Economic Research at Hitotsubashi University, while continuing to serve as associate professor at the Institute of Statistical Mathematics and at Keio University.
Ask the Expert: Dr. Takafumi Kubota (Associate Professor, Tama University)
Prof. Kubota is a mathematician specializing in Applied mathematics and statistics. His work involves the analysis of spatial statistical data related to location and region and the analysis of medical and health risks, as well as data visualization. He worked at the Institute of Statistical Mathematics before being appointed to his current position at Tama University in 2014. Prof. Kubota is a 2014 recipient of the Toshiharu Fujita Award, and serves as a councilor and board member of the Japan Society for Computational Statistics.
The more alleys, the fewer suicide cases
Spending time in a community and making careful observations has always been the first step in research for Specially Appointed Associate Prof. Mayumi Oka of the Research Center for Medical and Health Data Science at the Institute of Statistical Mathematics. Her studies on suicide were no exception. After conducting surveys that found residents in regions that have few suicide cases were very much open to seeking help when needing it, Prof. Oka decided to further observe these communities to understand what made their residents think and behave in certain ways. She discovered that these cities and towns had highly clustered neighborhoods with a number of alleys weaving through them.
“I wondered if these alleys had something to do with the lower suicide rates among their residents, and decided to look into it,” Prof. Oka said.
We all know bacteria and viruses aren’t the only causes of illnesses; it’s becoming increasingly clear that societal and economic factors, such as poverty, increase risks for health-related issues, including suicide.
“But just wondering about the alley effect wasn’t going to help anyone. To use it as a tool to prevent suicide, I knew we needed to find a way to ‘quantify’ alleys and then figure out how to link that data with suicide rates,” she said.
That was easier said than done. First of all, she said, the definition of “alley” is quite ambiguous.
“There’s no rules about how wide an alley should be. Some of them don’t even show on maps. As everyone realizes, the number of alleys vary widely from community to community. Mountainous regions have few alleys while oceanfront communities with clustered neighborhoods have more alleys,” Prof. Oka said. “In the end, a ‘roji’ -- which means an alley in Japanese -- can be loosely defined as a daily used path, which is wide enough for walking and biking but too narrow for driving.“
In order to objectively determine how many alleys exist in each community, Prof. Oka decided to create an alley indicator index. The feedback that she solicited from researchers in statistics, urban engineering, and civil engineering, as well as the cooperation from mapping companies were instrumental in developing the index.
The alley count estimation method that Prof. Oka developed focuses on the high likelihood of finding an alley between a property that has no frontage and a nearby roadway to which it needs access. The alley index, which has achieved an accuracy rate of 82 percent against the counts from detailed field surveys, earned Prof. Oka a prestigious research award from the Association of Precise Survey and Applied Technology in 2019.
Identifying social risk factors through analysis that combines qualitative and quantitative approaches
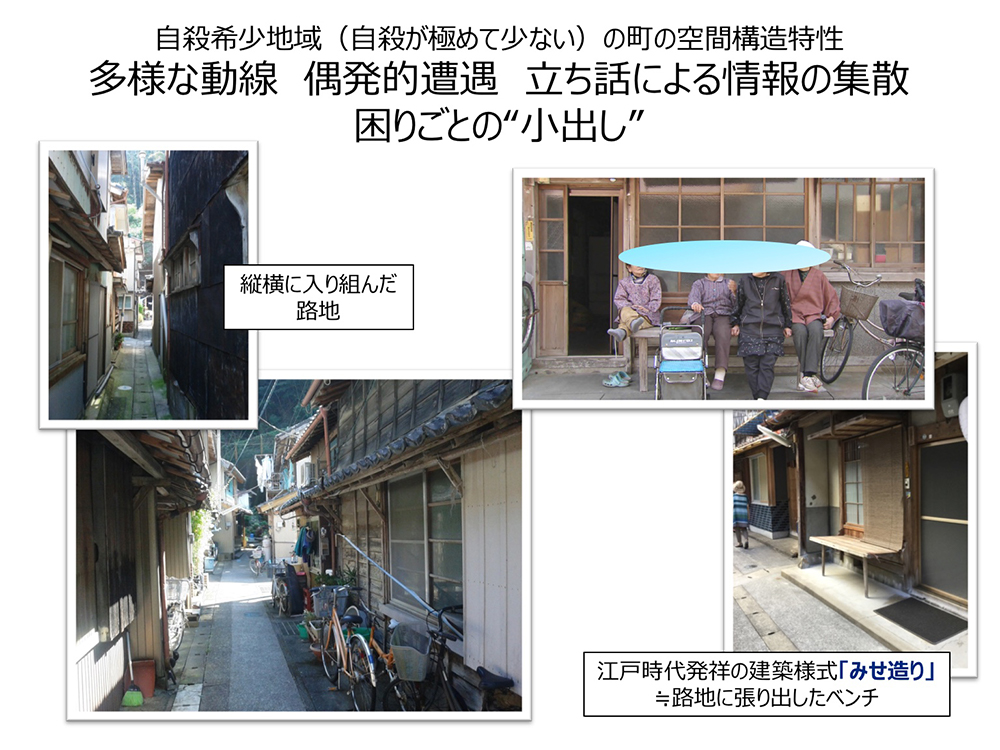
Diverse lines of communication Accidental encounters
Information exchange through an alley version of “water cooler talk”
Confiding in each other with personal problems
bottom right: “Mise-zukuri,” an architectural style from the Edo period features structure-attached outdoor benches that protrude invitingly into the alleyways, providing lounging space.
So, what are the steps to create such an indicator?
For Prof. Oka, the first step is always a careful land survey on foot.
“We would first visit the site and try to use all of our five senses to understand what an alley really is. Then we’d write down our understandings and discuss what kind of logic can bring together all of those elements that make a path an alley,” Prof. Oka said. “That’s what we call the ‘roji logic.’”
The next step is calculating the number of alleys based on the logic.
“We then go back to the community to see if the calculation matches the actual alley count. We’d repeat this process until we achieve an accuracy of over 80 percent,” she said.
This combination of both the qualitative and quantitative approaches has always been Prof. Oka’s signature method.
“It’s important to visit the site because you can overlook some indicators otherwise. You go back to the site and see if the actual count matches your calculation. If it doesn’t, you can correct how you calculate and improve the method,” Prof. Oka said. “It’s important to me that the data we generate fits reality. If I think there’s a missing element that contributes to inaccuracy, I continue to look for that element until I determine what it is. That’s my obsession.”
Prof. Oka used this method to take an inventory of alleys in communities in Tokyo, Osaka and Mie Prefecture, and the picture that emerged from the results was clear and simple: The more alleys a community has, the lower its suicide rate is.
“Perhaps, being in an alley helps people communicate more and better with each other. There are many other conceivable explanations for the link between alleys and lower suicide rates,” she said. “In order to maintain the health of a community, detecting problems that affect residents early is very important. Problems like domestic violence and child abuse often come to light only after the situations have become serious. But in communities that have lower suicide rates, these problems aren’t overlooked as much. We intend to further analyze how alleys can promote early detection of problems and intervention, and will use the information as a springboard to understand the structural characteristics that a community must have to enable quality living.”
“In fact, we are now seeing meaningful correlations between such physical environmental factors and the health of a community,” Prof. Oka said.
“Before I entered the world of research, the word, “data,” evoked an image of an endless series of inorganic numbers. But as I became a researcher and began gathering scattered data from across society, I came to understand that if you accumulate and analyze data that are related to various happenings, the profile of the people involved in those events will begin to emerge. I mean, their subconsciousness and way of thinking will become clear. In other words, data is a material that’s extremely revealing of human nature. That keeps me interested in data.”
Verifying ‘roji index’ through the lens of spatial statistical study
Prof. Oka began her alley research more than 10 years ago after she investigated the “slope grades of habitable land” (degrees of the steepness of habitable land) as a factor to gauge suicide risks. In the study, she used the datasets of suicide rates in each of 3,318 different municipalities, which then-Prof. Toshiharu Fujita of the Institute of Mathematics had compiled.
“Processing and standardizing data was a lot of work back then, because there was no big data or ‘Onside Facility,’” Prof. Oka said. Onsite facilities are those that are specially designed to ensure secure data mining operations.
She recalled how Prof. Fujita used to liken data to food.
“He said, ‘If data is bad, you can only produce so much results, no matter how skilled the chef is. So, you have to put forth your best effort to prepare data.’ I take his words to heart to this day.”
It was also around that time when Prof. Oka began a joint search project with Associate Professor Takafumi Kubota of Tama University, who specializes in the study of spatial statistics.
“It all started when Prof. Oka contacted me, asking for my advice on how to calculate elevation grades,” Prof. Kubota said. “I remember discussing with Dr. Hiroe Tsubaki, the incumbent director of the Institute of Statistical Mathematics, that the relationship between slope and suicide could become clearer if we use a nonlinear model for analysis,” Prof. Kubota said.
The idea turned out to be transformative for the research.
In their joint research, Prof. Oka developed a nonlinear model to show correlations among factors, and Prof. Kubota reviewed how the model interpreted data. They created charts that combine “suicide SMR” for each community with two different factors: elevation and slope grades.
SMR stands for standardized mortality ratio, and is often used in geographical studies on suicide.
“From this nonlinear model chart, we can see that a higher elevation does not necessarily translate into a higher suicide rate,” Prof. Kubota said, referring to the chart that incorporates elevation. “But when you combine the slope factor instead, you can see that having a strong influence on the suicide rates.”
And that’s something that a linear model couldn’t show, according to Prof. Kubota.
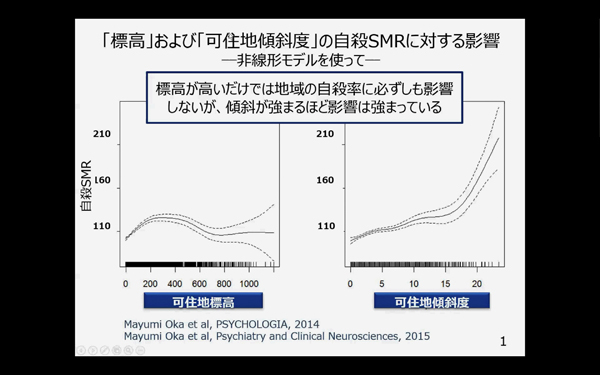
A higher elevation doesn’t necessarily translate into higher suicide rate,
but a steeper slope grade does.
Right: Suicide SMR with slope grades
“Suicide SMR” compares the actual number of cases in individual communities with the expected number of suicide cases by using “100” as to express the latter.
“The higher the SMR number, the large number of suicide cases. For example, ‘30’ would mean that suicide doesn’t happen as often in the particular community, whereas ‘300’ would indicate three times higher the expected suicide rate,” Prof. Kubota said.
Expert Dialogue: Suicide in the unprecedented pandemic society

So, what can the studies on suicide and geographical characteristics teach us about potential impact of the global new coronavirus pandemic? Here’s the conversation between Profs. Oka and Kubota about the future outlook.
Prof. Kubota: “There have been two major economic crises since the end of World War II, and the suicide rate dramatically rose each time. But when you look at the statistic more closely, you will notice that the suicide rates didn’t climb as sharply in the communities that had had few suicide cases to begin with. In contrast, the suicide rates shot up during those economic crises in the communities that had always had many suicide cases. In other words, it’s conceivable that though the entire country was exposed to the same economic crises, the certain factors that prevented suicides in some communities worked during those crises as well, curbing increases in the suicide rate.”
Prof. Oka: “In Japan, the link between economy and suicide is extremely strong in comparison to many other countries. The lesson we can learn from this historical fact is that we must study this connection very closely, so suicide cases won’t soar in number again the next time the economy declines. Now is the time to remember this lesson, as the global spread of Covid-19 infections is having a tremendous impact on human society. If we ever see the suicide rates shoot up, I would like to collaborate with you again to analyze the factors behind the increases in the suicide rate.”
Prof. Kubota: “Likewise. The history shows that the number of suicide cases -- the suicide rate -- tends to decline during the first several months following the onset of a crisis. That was also true for the coronavirus pandemic. Even in April and May 2020, when the state of emergency had been declared and everyone was feeling very anxious, the suicide rate was lower than that of the same period the year before. But July’s and August’s preliminary suicide rates released by the National Police Agency were higher than those of the same months the year before. Through the data analysis we are conducting in collaboration with the Japan Suicide Countermeasure Promotion Center, we are seeing that there are several stages leading up to suicide; people first experience general anxiety, which becomes more distinct as concerns about the economy and their health grow, and then a death wish, or suicidal thoughts begin to arise. That’s basically how it progresses. So, we need to stop the progression at one point or another.
Prof. Oka: “That is right.”
Prof. Kubota: “There are economic factors on the fundamental level, and we can dig deeper into more specific factors from there, such as physical characteristics of regions, as well as rojis. I’m personally interested in chronological examinations. I think we need to be able to predict when and how the suicide rate begins to rise among what types or groups of people, and also need to seek evidence to back up counteractive measures. For example, we can study whether the levels of anxiety among people tend to decline following the government’s announcement to distribute 100,000 yen (approx. $1,000 USD) per household in economic impact payments. We can also examine how people are affected by the pandemic situations that they’ve never experienced before, such as not knowing when a Covid-19 vaccine would become available and how much longer the current situation will continue.”
Interviewer: Rue Ikeya
Photographs: Yuji Iijima
Released on: Dec. 10, 2021 (The Japanese version released on Sept. 10, 2020)
* This interview was conducted online.